
Fig. 1.
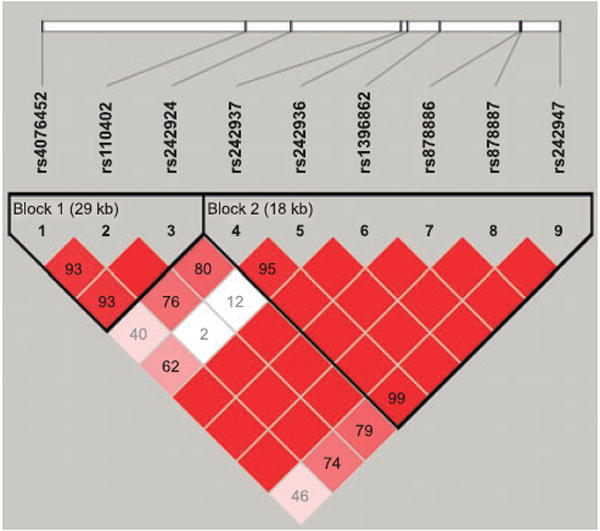
Pair-wise measures of linkage disequilibrium (LD) plot of the 9 CRHR1 SNPs based on subjects included in this study. The Lewontin’s standardized disequilibrium coefficient, D’, value of each SNP pair is shown in the squares. The numbers in the squares are D’ × 100. Empty squares indicate D’ = 1. Squares are colored bright red (dark gray) if the D’ value is high and the confidence in the value of D’ is high as well.