
Fig. 2.
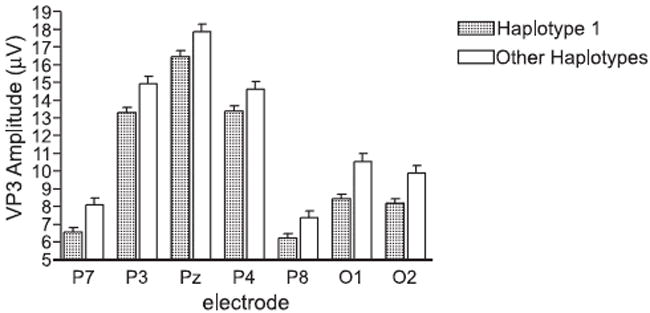
Mean target visual P3 amplitude at the seven posterior electrodes grouped by haplotypes. The bars represent the mean value; the vertical lines issuing from the bars represent the standard error of mean (SEM). Individual p-values are shown in Table 4.