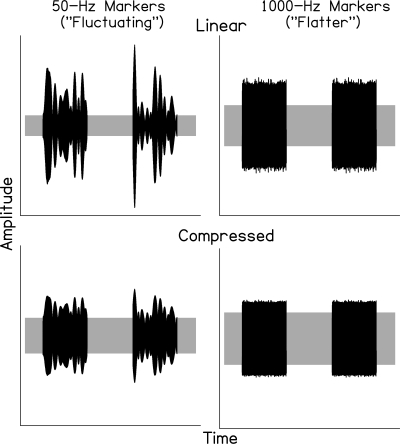
Figure 1.
Schematics of markers (black), including gaps and continuous background noise (gray). The fluctuating and flatter markers are shown in the left and right panels, respectively. The temporal envelopes of marker-plus-background signals with and without effects of a basilar-membrane compressor are illustrated in the bottom and top panels, respectively. A formula proposed by Glasberg and Moore (2000) was used for the compression function.1 For ease of viewing, the linear and compressed signals (in the top and bottom panels) have been scaled to equate marker rms.

