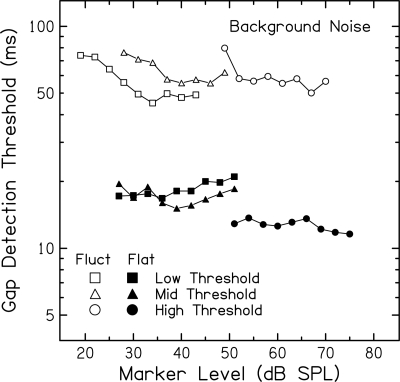
Figure 3.
Mean gap detection thresholds (ms) for subjects in the Low Threshold (squares), Mid Threshold (triangles), and High Threshold (circles) groups plotted as a function of marker level (dB SPL within the ERB centered around 1000 Hz). Results are shown for the flatter (closed) and fluctuating (open) markers presented in background noise at fixed SNRs. More than half the subjects in each group must have measurable thresholds for a mean data point to be included.

