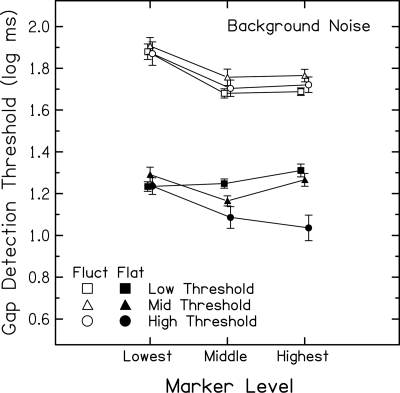
Figure 4.
Mean gap detection thresholds (log ms) for subjects in the Low Threshold (squares), Mid Threshold (triangles), and High Threshold (circles) groups plotted against each subject’s lowest, middle, and highest marker level for the flatter (closed) and fluctuating (open) markers presented in background noise at fixed SNRs. For clarity, some data points are offset along the abscissa. Error bars indicate ±1 SE.

