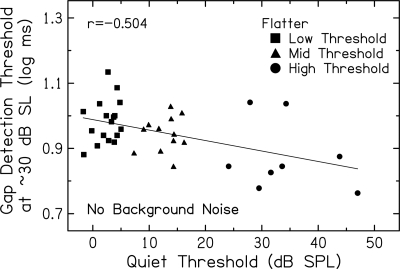
Figure 8.
Gap detection thresholds (log ms) for the flatter marker at ∼30 dB SL plotted against quiet thresholds (dB SPL) for subjects in the Low Threshold (squares), Mid Threshold (triangles), and High Threshold (circles) groups. The Pearson correlation coefficient and linear regression function are included.

