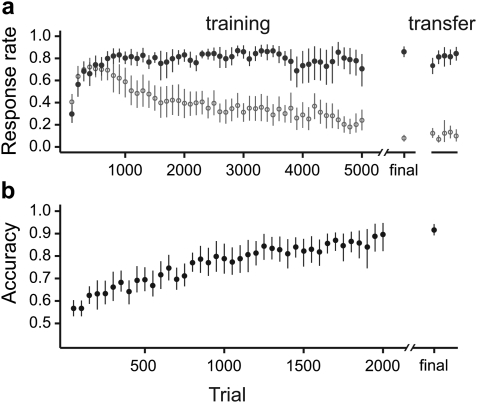
Figure 3.
(Color online) Acquisition curves for (a) SD and (b) 2AC tasks. In (a), the left panel shows initial acquisition of the SD task. Trials have been grouped into blocks of 100. Open circles show the proportion of false alarms and closed circles show the proportion of trials in which the transition to a different motif was correctly detected. Performance in the last 200 trials is shown by the final set of symbols. The right panel shows responses after transfer to a larger stimulus set. In (b), trials have been grouped into blocks of 50, and the average accuracy in each block is shown, with performance in the final 200 trials indicated by the final symbol. In both plots, symbols show mean across birds, with 95% confidence intervals estimated by bootstrapping.

