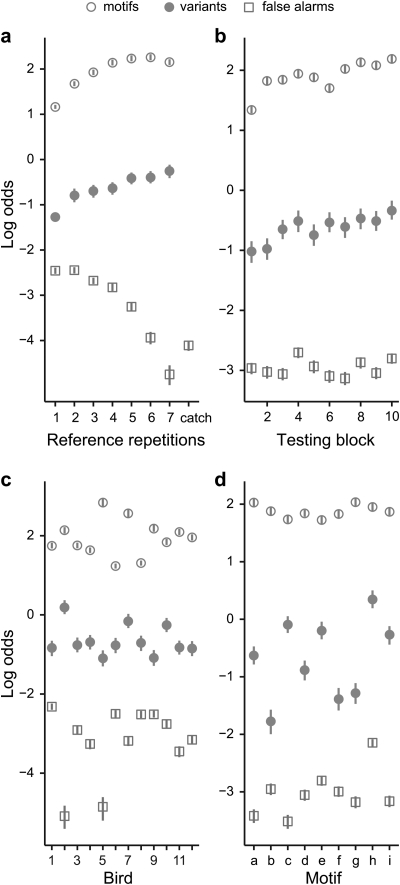
Figure 5.
(Color online) Response rates (log odds scale) as a function of (a) the number of times the reference stimulus was repeated, (b) the testing block, or number of times the bird had heard a given stimulus pair, (c) the subject, and (d) the motif. Open circles indicate the mean hit rate for trials where the stimuli were different motifs; closed circles indicate the hit rate for trials where the stimuli were different variants of the same motif; and open squares indicate the false alarm rate for all trials. Error bars indicate 95% confidence intervals. Catch trials, in which the reference stimulus was repeated more than seven times, and no transition to a target occurred, are grouped into a single category in (a); because the reference motif could repeat up to five times during this interval, the false alarm rate is corrected to reflect the average probability of a response during one of the repetitions. In (d), the hit rate is shown as a function of the reference motif. The variants of motif “b” are shown in Fig. 1c, and the variants of “e” in Fig. 1b.

