
Figure 3.
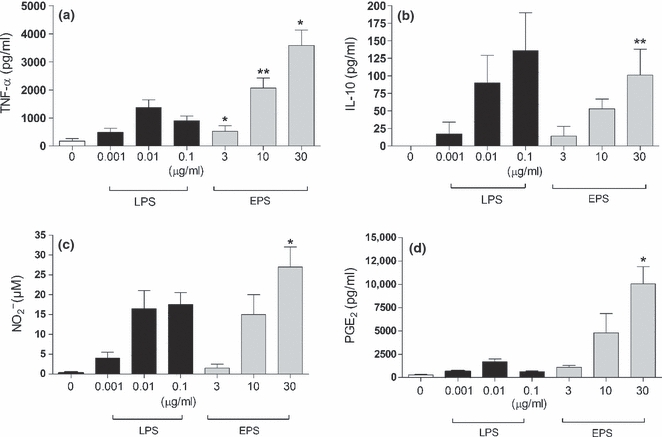
Comparison of EPS and lipopolysaccharide (LPS) capacity to induce the production of inflammatory mediators. Mouse peritoneal macrophages (5 × 10⁵ per well) were stimulated with indicated concentrations of either EPS (grey bars) or LPS (black bars). After 24 h, supernatants were collected and the amounts of TNF-α (a), IL-10 (b),  (c) and PGE2 (d) were determined as described in Methods. Data are mean ± SEM values of three independent experiments. *P < 0.05; **P < 0.005, EPS-treated vs. untreated macrophages.