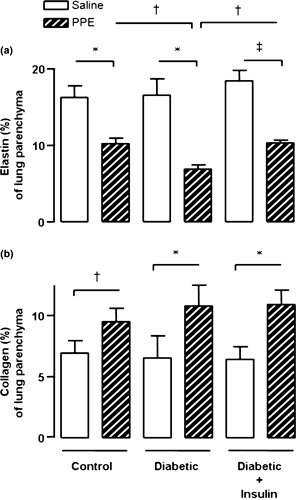
Figure 3.

Fraction of area (%) occupied by elastin (a) and collagen (b) in the lung parenchyma of control (n = 8), diabetic (n = 7) and insulin-treated diabetic (n = 7) rats, 50 days after porcine pancreatic elastase (PPE, right lung) or saline (left lung) instillation. Diabetic rats were treated with 4 IU neutral protamine Hagedorn insulin, 2 h before instillation, followed by 2 IU/day for the next 50 days. Data are presented as means ± SEM and analysed by one-way anova followed by the Tukey–Kramer multiple comparisons test as follows: ‡P < 0.001, †P < 0.01 and *P < 0.05 compared with corresponding values in saline-treated lungs; †P < 0.01 compared with values in PPE-treated lungs from diabetic rats.
