
Fig. 2.
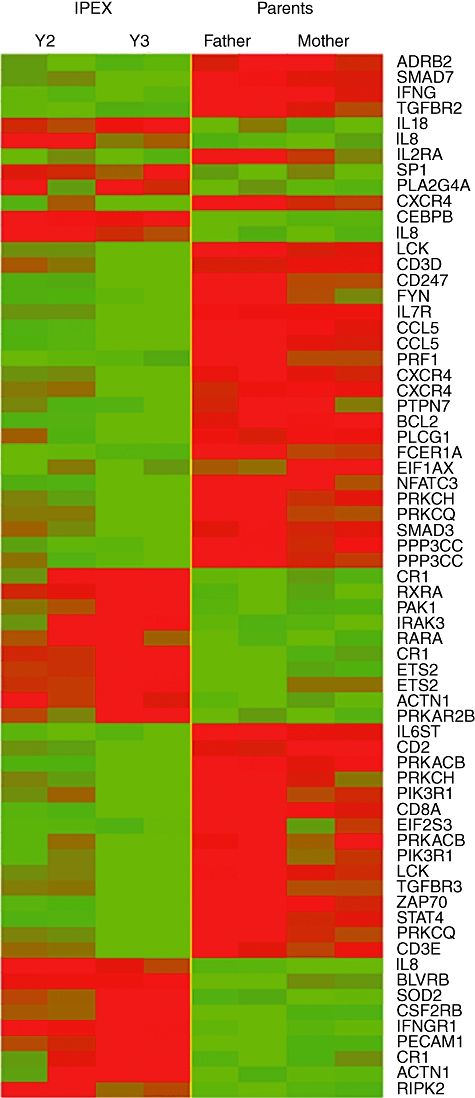
Clustered heatmap graphic representation of the 67 significant genes expressed differentially in the two youngest patients (on the left) and their parents (on the right). Details on gene-related proteins are given in Table 3. The green colour indicates down-regulated genes, red colour over-expressed genes.