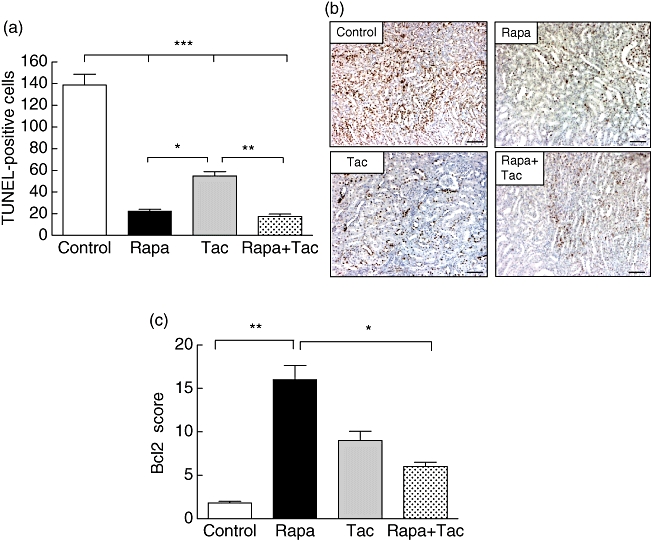
Fig. 3.

Apoptosis and Bcl2 expression. (a) Apoptotic cells using the terminal deoxynucleotidyl transferase deoxuridine triphosphate (dUTP) nick end labelling (TUNEL) method in outer and inner medulla. The total number of labelled nuclei was counted in 10 fields of 1 mm2. As normal kidney control, the number of positive apoptotic nuclei in sham animals was lower than 6/mm2 located only in deep medullary epithelial tubules. (b) Representative TUNEL staining of kidney sample after 24 h of reperfusion. Positive apoptotic cells appear with brown stained nuclei in outer medulla and cortex (A × 100, scale bar = 100 µ). (c) Immunohistochemical score of Bcl2 in renal tissue from transplanted rats. Quantitative analysis of Bcl2 expression was assessed in 10 consecutive cortex and medulla fields. Values are mean ± standard deviation (n = 6). *P < 0·05, **P < 0·01 and ***P < 0·001 for comparison between groups.
