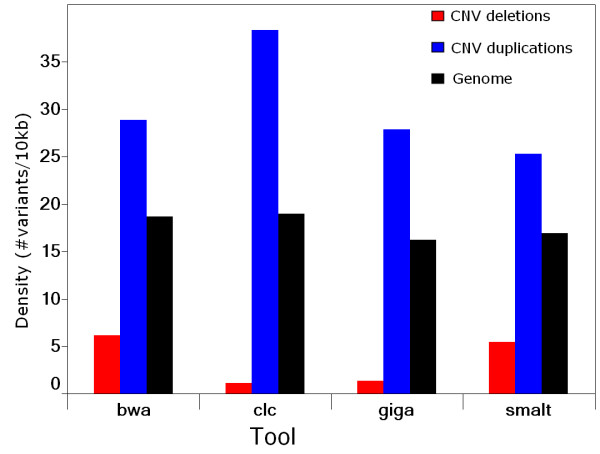
Figure 6.
Densities of small variants detected within CNV regions by different pipelines. Densities were measured as number of variant per 10 kb averaged across CNV duplication, CNV deletion and the whole genome. smalt, SMALT+SAMtools pipeline; bwa, BWA+SAMtools pipeline; clc, CLC Genomics Workbench; giga, Mosaik+GigaBayes pipeline.

