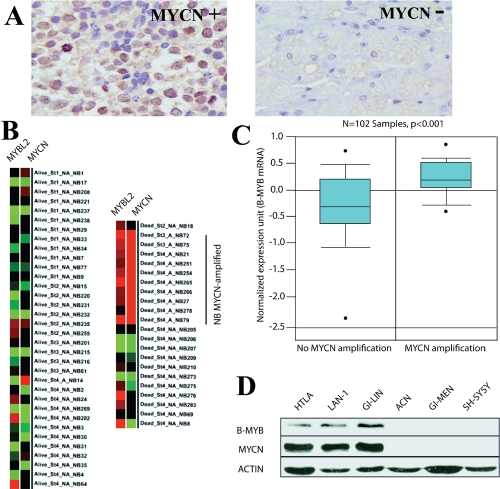
Figure 1: Expression of B-MYB correlates with MYCN status in neuroblastomas.
A) Immunohistochemical analysis of B-MYB protein in primary human neuroblastomas. Strong nuclear B-MYB staining is detected in the MYCN amplified specimens [n = 3]. B) B-MYB gene expression profiling in 56 pretreatment primary neuroblastoma tumor samples. For each sample is specified the stage, the outcome (alive/dead) and the presence of MYCN amplification. Red indicates high whereas green indicates low gene expression levels. The expression profile was mined from the Oncogenomics web site (home.ccr.cancer.gov/oncology/oncogenomics/) C) Box plot of B-MYB mRNA epression in primary human neuroblastomas with or without MYCN amplification. The plot was obtained using the Oncomine Web site (www.oncomine.org), where the information regarding the neuroblastoma samples can also be found. Statistical significance was assessed by Student t test [p < 0.001 in 102 samples]. mRNA datasets are normalized by being log 2 - transformed, with the median set to 0 and SD set to 1. All statistical tests were two-sided. C) Western blot analysis showing expression of B-MYB in MYCN amplified or non amplified cell lines. Antibodies recognising MYCN, B-MYB and actin [as a loading control] were used, as indicated.

