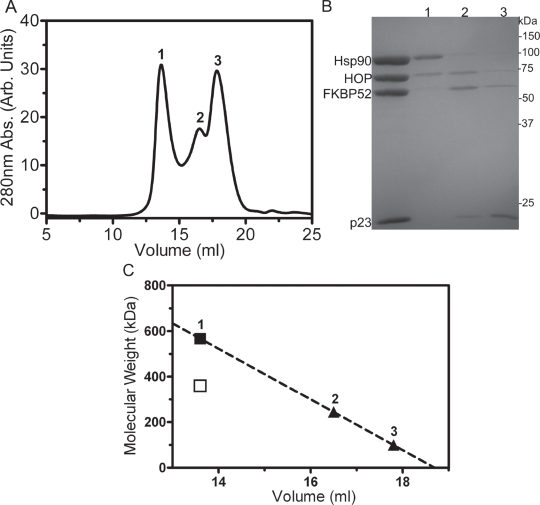
Figure 6. Analytical Superose6 size-exclusion chromatography.
(A) Size-exclusion chromatogram highlighting the separation of the Hsp902-FKBP521-HOP2 complex (peak 1) from unbound constituents (peaks 2 and 3). (B) 10% SDS-PAGE results of the three respective chromatographic peaks. (C) A linear regression of the Superose6 elution positions of protein standards was used to interpolate the molecular weights of the proteins eluting within the three peaks. The solid square and triangles represent the interpolated molecular weight values of the Hsp902-FKBP521-HOP2 complex and unbound constituents derived from the linear regression (R2=0.98). The hollow square denotes the molecular weight value of the Hsp902-FKBP521-HOP2 complex derived from primary sequence information

