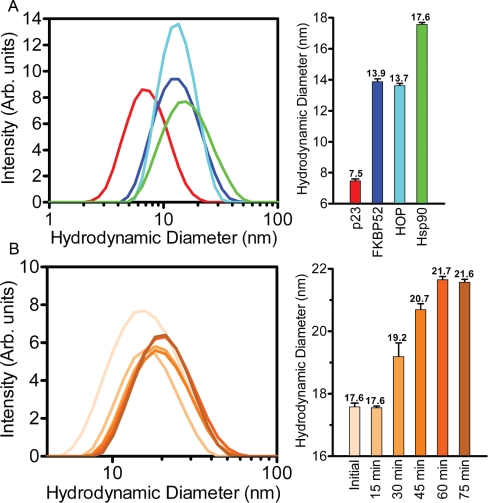
Figure 7. Hsp902-FKBP521-p232-HOP2 complex formation revealed by DLS.
(A) Dynamic light scattering spectra of the p23 (red), FKBP52 (blue), HOP (cyan) and Hsp90 (green) proteins illustrate diametric values that range between 7.6 and 17.6 nm as depicted on a logarithmic x-axis. Each individual constituent protein had a measured polydispersity values between 0.36-0.49.(B) The lateral shift in hydrodynamic diameter (increase in size) of the Hsp902-FKBP521-p232-HOP2 complex (contrasting shades of orange) over the course of a 75 minute incubation at 30°C. Each individual sub-panel contains a bar graph representation of the DLS measurements outlined in the respective colors. Error bars depict the standard deviation within a 95% confidence interval.

