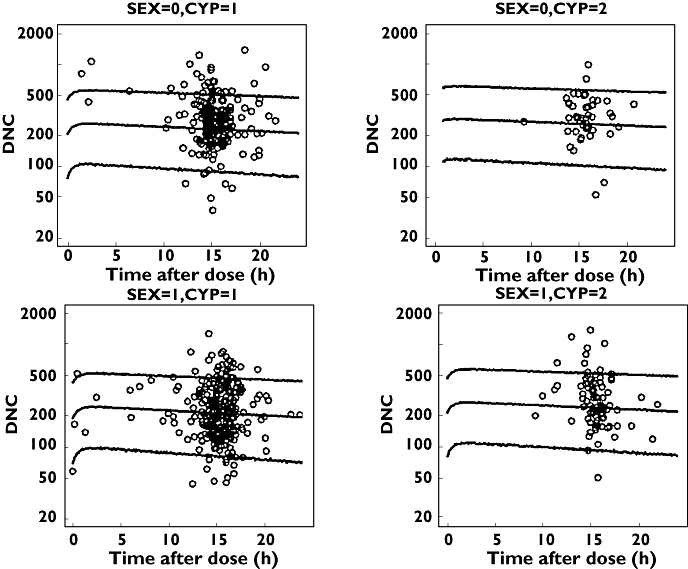
Figure 3.

S-Warfarin visual predictive check for some covariate groups using dose-normalized observed and predicted concentrations against time. The lines are the 5th, 50th and 95th percentiles and the open circles are observed plasma concentration

S-Warfarin visual predictive check for some covariate groups using dose-normalized observed and predicted concentrations against time. The lines are the 5th, 50th and 95th percentiles and the open circles are observed plasma concentration