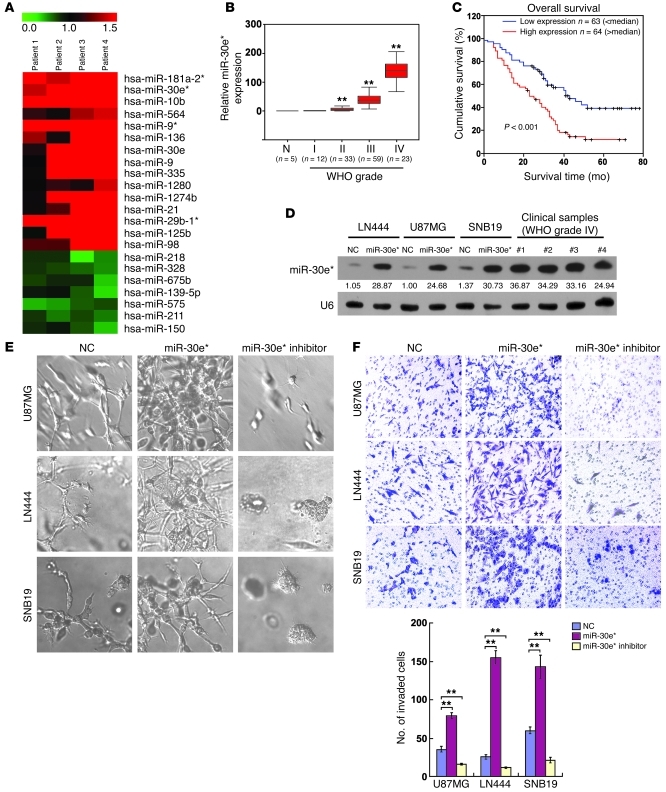
Figure 1. Upregulation of miR-30e* enhances invasiveness of glioma cells.
(A) miRNA array analysis showed that miRNAs were differentially expressed in GFAP+ cells isolated from clinical glioma and adjacent brain tissues. The pseudocolor represents the intensity scale of tumor versus adjacent brain tissue. (B) Correlation between miR-30e* expression assessed by real-time PCR and WHO grading of glioma and normal brain tissues (N). Transcript levels were normalized by U6 expression. The bounds of boxes represent the lower and upper quartiles; lines within boxes and whiskers denote median and extremum, respectively. (C) Correlation between miR-30e* levels and survival by Kaplan-Meier analysis of patients with high (greater than the median; n = 64) or low miR-30e* (less than the median; n = 63) expression. (D) Northern blot analysis of miR-30e* expression in glioma cells transfected with negative control (NC) and hsa-miR-30e* mimic oligonucleotides, as well as 4 clinical WHO grade IV glioma tissues. The expression levels of miR-30e* in the transfected gliomas cells were within the range of the endogenously expressed miR-30e* levels in human gliomas (see Supplemental Methods). Numbers below the panels are quantifications of the signals obtained, determined by comparing the miR-30e*/U6 ratio in U87MG-NC cells. The miR-30e*/U6 ratio in U87MG-NC cells was set at 1.0. (E) Representative micrographs of indicated cells cultured in a 3D spheroid invasion assay. (F) Representative images and quantification of indicated invaded cells analyzed in a TMPA with Matrigel. Experiments in B–F were repeated at least 3 times, with similar results. **P < 0.01. Original magnification, ×400 (E); ×200 (F).

