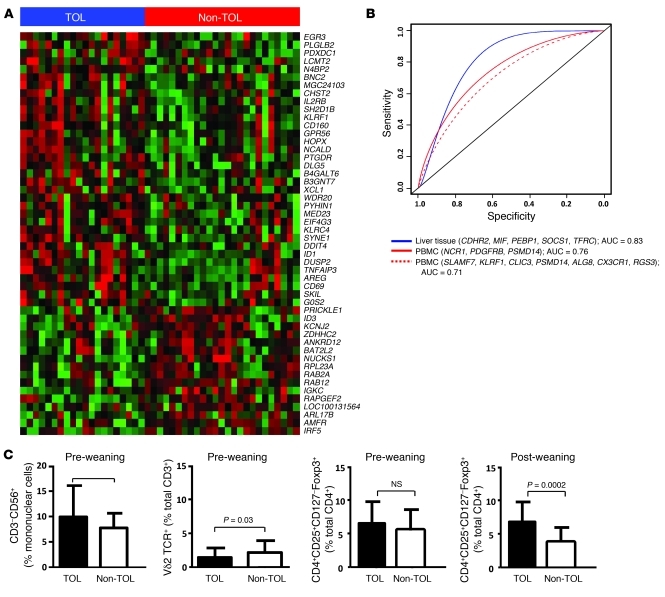
Figure 5. Before the initiation of immunosuppressive drug withdrawal, TOL and Non-TOL recipients differ in cellular and transcriptional peripheral blood markers.
(A) Heatmap displaying the 50 genes with the most significantly different expression when comparing PBMC samples collected from TOL and Non-TOL recipients (rows represent genes, and columns represent samples; the intensity of each color denotes the standardized ratio between each value and the average expression of each gene across all samples; red pixels correspond to an increased abundance of the transcript in the indicated samples, whereas green pixels indicated decreased transcript levels). (B) Overall diagnostic performance of liver tissue and PBMC-derived transcriptional signatures measured at patient enrollment in the prediction of successful drug withdrawal. (C) Differences between TOL and Non-TOL recipients in the proportion of PBMC subsets at enrollment and at the end of the study.

