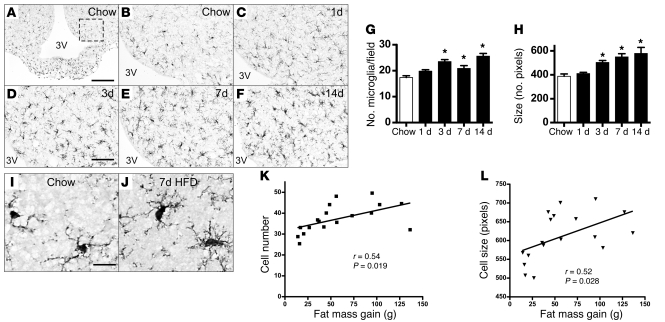
Figure 3. Histochemical analysis of HFD-induced microglial accumulation in rat ARC.
Immunohistochemical detection of Iba1 protein, a microglial marker (25), in coronal sections of rat hypothalamus (14 μm) from animals fed either (A and B) chow or (C–F) HFD for up to 14 days. (A) Low-magnification view (original magnification, ×10) of microglia distributed throughout the MBH. The dashed box indicates the region used for quantification of ARC microglial number and size in G and H. 3V, third ventricle. Scale bar: 100 μm. (B–F) Higher-magnification view (original magnification, ×20) of Iba1 immunohistochemistry in the ARC of rats fed (B) chow or (C) HFD for 1 day, (D) 3 days, (E) 7 days, or (F) 14 days. Scale bar: 50 μm. (G and H) Quantification of (G) mean ARC microglial cell number (per field defined in A) and (H) microglial cell size (average number of pixels in 10 largest cells) from rats fed either chow or HFD (n = 6/group). *P < 0.05 versus chow. (I and J) Comparison of microglial fine structure in hypothalamus of rats fed (I) chow or (J) HFD for 7 days. Microglia from HFD-fed rats manifest a more “ameboid” morphology, characterized by larger cell bodies with thickened and shortened processes. Scale bar: 10 μm. (K) Correlation of microglial cell number and fat mass gain (g) over 2–8 weeks of HFD consumption, with indicated linear regression line. (L) Correlation of microglial cell size (no. pixels in 10 largest cells/ARC) and fat mass gain (g) over 2 to 8 weeks of HFD consumption, with indicated linear regression line. Each symbol in K and L represents an animal.

