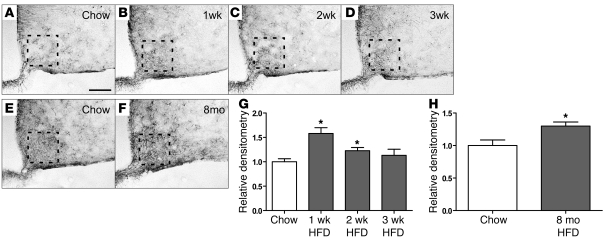
Figure 4. Time course of the effect of HFD feeding on hypothalamic astrocytes.
(A–D) Representative images of astrocytes identified by immunohistochemical detection of GFAP protein in coronal sections of hypothalamus (10 μm) obtained from 10-week-old mice fed either (A) chow or HFD for (B) 1 week, (C) 2 weeks, or (D) 3 weeks. (E and F) GFAP staining of hypothalamic sections from 8-month-old mice fed (E) chow or (F) HFD. Scale bar: 50 μm. (G) Quantification of GFAP staining intensity (mean ± SEM) in the region of the ARC from mice fed either chow or HFD for 1 to 3 weeks (n = 6/group). (H) Quantification of GFAP staining intensity (mean ± SEM) in mice fed chow or HFD for 8 months. *P < 0.05 versus chow. The dashed boxes indicate the region used for quantification in G and H.

