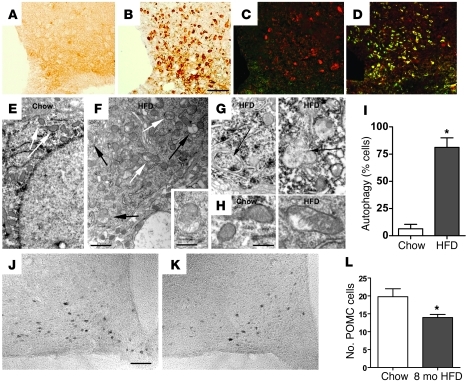
Figure 6. Effect of HFD feeding on hypothalamic markers of neuronal injury and on POMC cell number.
(A–D) Immunohistochemical analysis of the neuronal injury marker Hsp72 in the ARC of rats fed (A and C) chow or (B and D) HFD for 7 days. Immunofluorescence in C and D shows colocalization of Hsp72 (green) with POMC peptide (red). (E and F) Electron micrograph of a POMC neuron from a mouse fed (E) chow or (F) HFD for 20 weeks. In E, no pathological changes in cytoplasm or mitochondria (white arrows) are observed, whereas, in F, mitochondrial integrity is disrupted (white arrows), and mature and developing autophagosomes are present (black arrows). The inset in F is a higher-magnification example of an autophagosome. (G) Additional high-magnification examples of autophagosomes (black arrows). (H) High-magnification images of POMC neuron mitochondria from mice fed chow (parallel-oriented cristae and regular structure) or HFD (nonparallel cristae and irregular shape). (I) Quantification of percentage of POMC neurons with autophagosomes (n = 5 cells examined in each of 5 mice). *P < 0.05 versus chow. (J and K) Representative images of POMC neurons in the ARC of mice fed either (J) chow or (K) HFD for 8 months. (L) Quantification of POMC neuron number in the hypothalamus of mice fed chow or HFD for 8 months (mean ± SEM; n = 8/group). *P < 0.05 versus chow. Scale bar: 50 μm (A–D, J, and K); 1 μm (E and F); 500 nm (F, inset); 400 nm (G and H).

