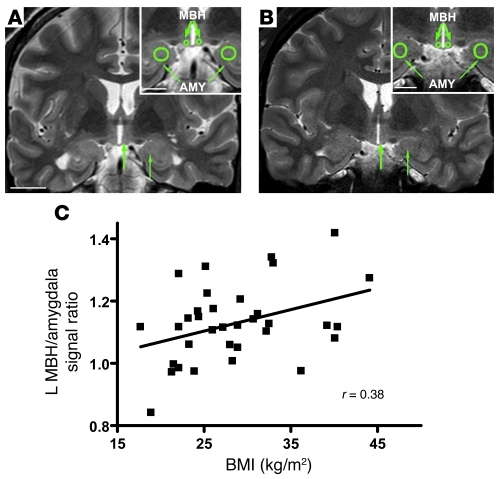
Figure 7. Radiologic evidence of gliosis in the MBH of obese humans.
Representative coronal T2-weighted images through the hypothalamus from (A) a normal weight and (B) an obese subject. Insets show the placement of right and left ROIs (green circles) in the MBH and amygdala (AMY). In the MBH (thick arrows) of the obese subject, signal ratios demonstrated subtle hyperintensity (brightness) relative to the amygdala (thin arrows). Scale bar: 20 mm; 10 mm (insets). (C) Correlation of BMI with MBH hyperintensity as measured by left (L) MBH/amygdala signal ratio (n = 34 subjects; r = 0.38; P = 0.027).

