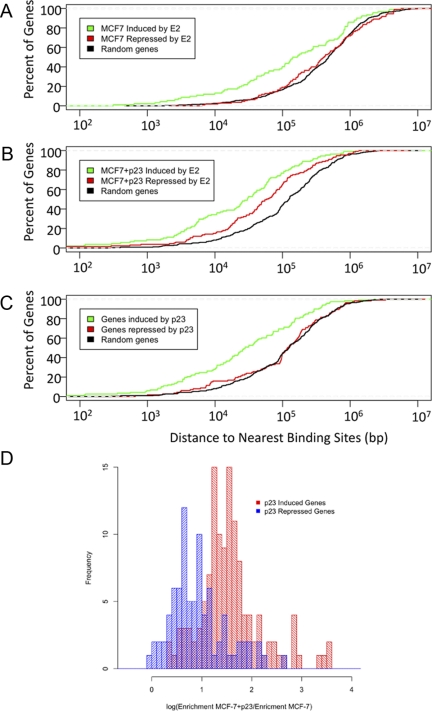
Fig. 2.
p23 overexpression in MCF-7 cells increases ER recruitment to EREs both distal and proximal to p23 and E2-regulated genes. Percentage of E2-responsive (A and B) or p23-responsive (C) genes (y-axis) that have ER binding within a given distance from the transcription start site (x-axis) in (A) MCF-7-control cells, (B) MCF-7+p23 cells, and (C) p23-dependent ER-binding sites in MCF-7 cells. Green line, p23-induced genes; red line, p23-repressed genes; black line, random set of genes. D, Histogram showing an enrichment of ER binding in the presence of E2 treatment in MCF-7+p23 cells relative to MCF-7-control cells at p23-induced genes (red) but not at p23-repressed genes (blue).

