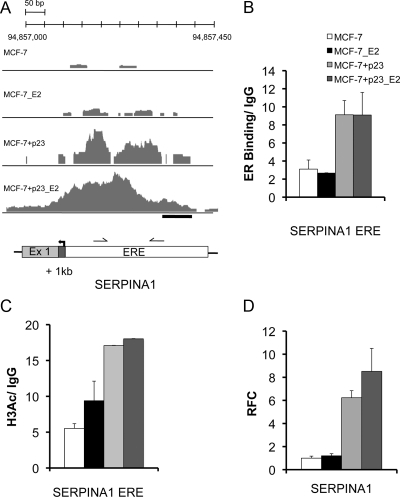
Fig. 3.
ER binding and mRNA regulation of SERPINA1 by E2 and p23. A, The number of overlapping sequence tags represented as peak height is shown for SERPINA1. ER peaks are detected at the promoter proximal ERE upon E2 treatment in MCF-7-control cells, whereas only residual binding is observed in the absence of ligand. In MCF-7+p23 cells, bound ER is increased in both the absence and presence of E2. B, Validation ChIP assays were performed at ChIP-seq-predicted ER-binding sites for SERPINA1, a gene made more responsive to E2 by p23 overexpression. Shown is a schematic representation of SERPINA1 loci. Arrows indicate TSS; gray boxes, exons; white boxes, predicted ERE; black bars, regions amplified by qPCR to determine the level of ER binding. ChIP assays were performed using specific antibodies against ER or negative control IgG. Relative levels of ER binding in the presence and absence of E2 were determined using qPCR. Data are averages from replicate experiments, normalized to input, and presented as relative fold-enrichment over IgG control. Error bars, se. C, Increased basal ER recruitment in p23 overexpressing MCF-7 cells correlates with increased histone H3K9/14 acetylation. Directed ChIP were performed at the SERPINA1 ERE using specific antibodies against acetylated histone H3K9/14. Error bars, se. Note the error bars in the last two columns are so small and therefore do not show up readily on graph. D, The p23 and E2 responsiveness of SERPINA1 was examined in MCF-7-control and MCF-7+p23 cells using qPCR. Data are means from three independent experiments, normalized to glyceraldehyde-3-phosphate dehydrogenase, and presented as relative fold-change (RFC) of E2-treated MCF-7-control, E2-treated MCF-7+p23, or untreated MCF-7+p23 cells from that of untreated MCF-7-control cells, set to 1. Error bars, se.

