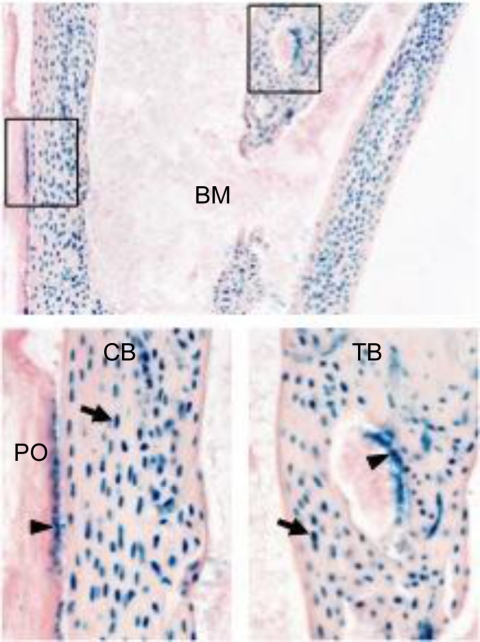
Fig. 1.
OBL and OCY express BMP3. Tibia from BMP3 4-wk-old LacZ knock-in mice stained for β-galactosidase. Diaphyseal region is shown in the top panel. The boxed areas in the upper panel are shown as magnified images (×20) of cortical bone (CB) and trabecular bone (TB) in lower panels. Arrowheads and arrows indicate OBL and OCY, respectively. BM, Bone marrow; PO, periosteum.

