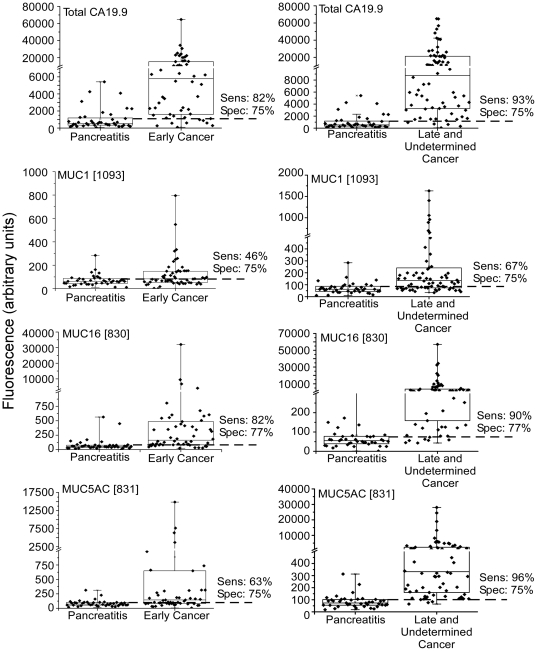
Figure 2. Total CA 19-9 levels and CA 19-9 on specific proteins.
The fluorescence values for the total CA 19-9 (top), CA19-9 on MUC1 (second row), CA 19-9 on MUC16 (third row), and CA 19-9 on MUC5AC (fourth row) are shown for each sample group. The left column compares samples from pancreatitis patients to samples from early-stage pancreatic cancer patients, and the right column compares pancreatitis to late-stage cancer. The sensitivity and specificity at the threshold indicated by the dash line are given.

