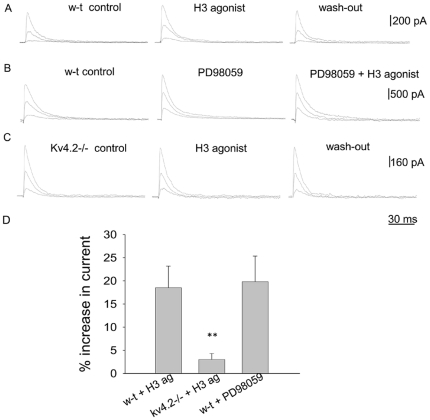
Figure 4. Effects H3 agonist on IA in w-t and Kv4.2−/− GABAergic preoptic neurons.
A,B. IA recorded from a w-t neuron (A) and a Kv4.2−/− neuron (C) in control (left), after 5 min incubation with R-α-methylhistamine (1 µM) (middle) and after washout of the agonist (right). B. IA recorded from a w-t neuron in control (left), after 5 min incubation with PD98059 (10 µM) (middle) and after subsequent 5 min incubation with R-α-methylhistamine (1 µM) (right). A–D. The currents were elicited by the voltage steps to −40, −30 and −20 mV from a holding potential of −110 mV. The extracellular solution contained TTX (1 µM), TEA (5 mM) and 4-AP (0.25 mM). E. Bar chart of the percentage increase in the peak IA amplitude (at −20 mV) test potential by R-α-methylhistamine (1 µm). ** indicates statistical significance of P<0.01 when compared with the other 3 columns (ANOVA, Kruskal-Wallis with Dunn's post test). The bars represent averages ±S.D.

