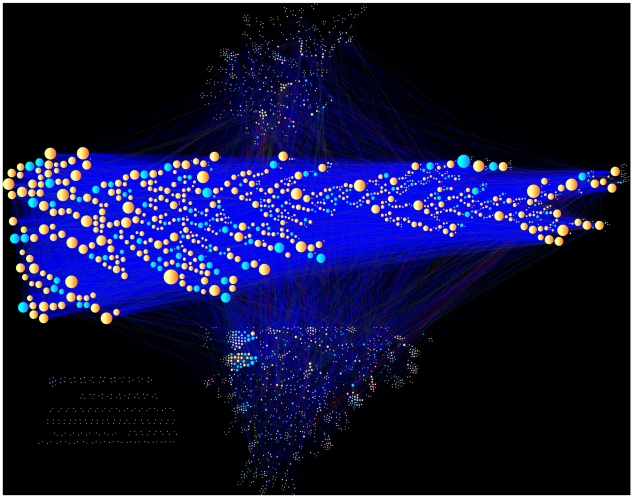
Figure 2. Network of predicted interactions comprised of 2509 proteins (nodes) and 28,886 interactions (edges) ranked by all three methods in the top 10% of predicted interactions.
Yellow nodes are prey only and blue nodes were used as bait at least once. Edges are colored according to the following criteria: Blue edges are predicted interactions that do not have reported direct or indirect interaction in the literature; Green edges are predicted interactions that have one or more reported indirect interaction (one intermediate); Red edges are recalled direct interactions.

