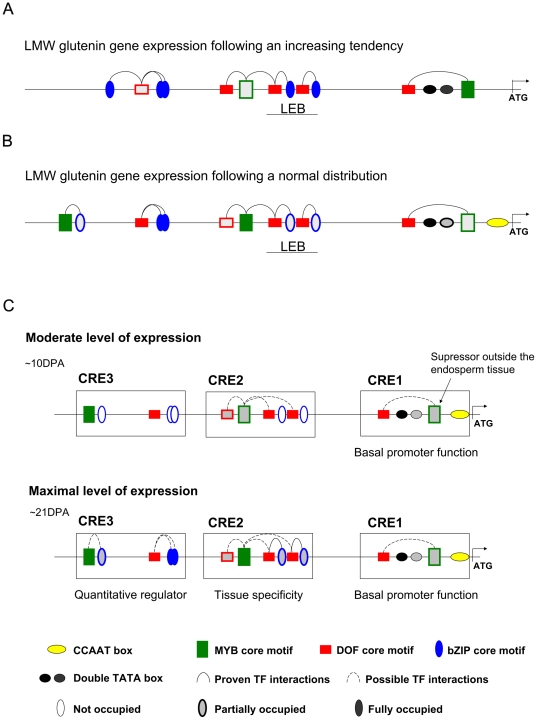
Figure 6. Model for the transcriptional regulation of LMW glutenin gene expression.
Intensity of geometric forms marks the frequency of these elements present in the promoter types or developmental phases. Most important cis-acting elements and the possible TF interactions are labelled. A - Promoter profile of LMW glutenin genes following a continuously growing expression; B – Promoter profile of gene types following a normal distribution in expressed transcripts during the seed development; C – model for transcriptional regulation in the early phase and mid phase of expression. Conserved non-coding sequence regions (CRE1, CRE2 and CRE3) are labelled with open rectangles. Developmental stages are labelled with DPA.

