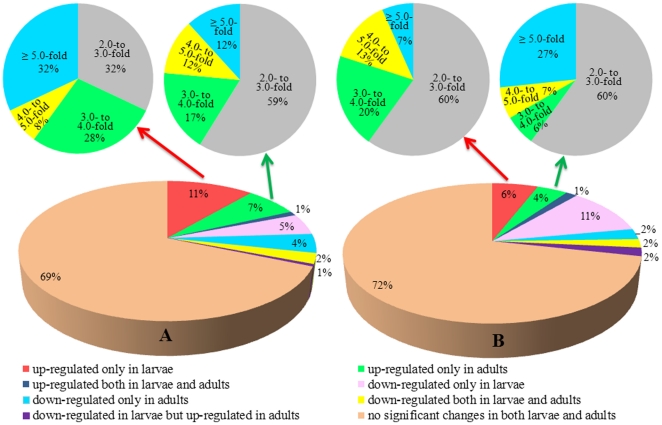
Figure 2. Diagrammatic representation of the analysis of the P450 gene expression profiles in both larvae and adults of permethrin selected mosquito populations HAmCqG8 and MAmCqG6 compared with their corresponding field parental populations HAmCqG0 and MAmCqG0.
The statistical significance of the gene expressions was considered to be a p value ≤0.05. Significant overexpression was analyzed using a cut-off value of a ≥2-fold change in expression [29]. A. P450 gene expression profiles in HAmCqG8. B. P450 gene expression profiles in MAmCqG6.

