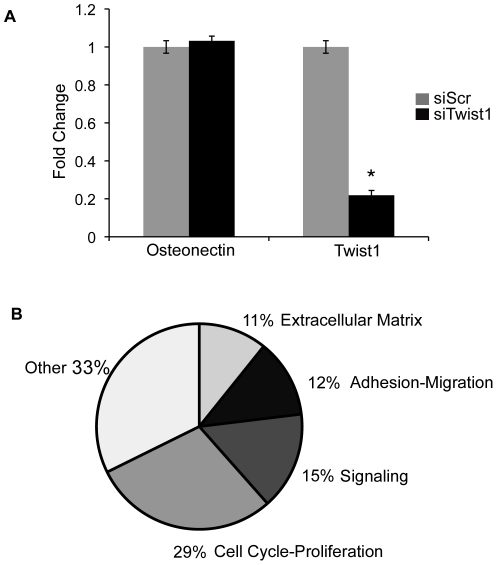
Figure 3. Knockdown of Twist1 results in decreased expression of genes associated with mesenchymal cell functions.
A. qPCR of Twist1 and Osteonectin expression confirms knockdown of Twist1 in MC3T3-E1 pre-osteoblast cells transfected with siTwist1 versus siScr controls. Fold change relative to siScr transfected cells, set to 1, ± SEM is shown. Statistical significance was determined by Student's t-Test, p = ≤0.05 indicated by *. All experiments were performed in biological and technical triplicate. Histograms are a compilation of n = 3 experiments. B. Twist1 candidate target genes from gene expression profiling with ≥2.0 fold decreased grouped by functional classifications are represented in a pie graph.

