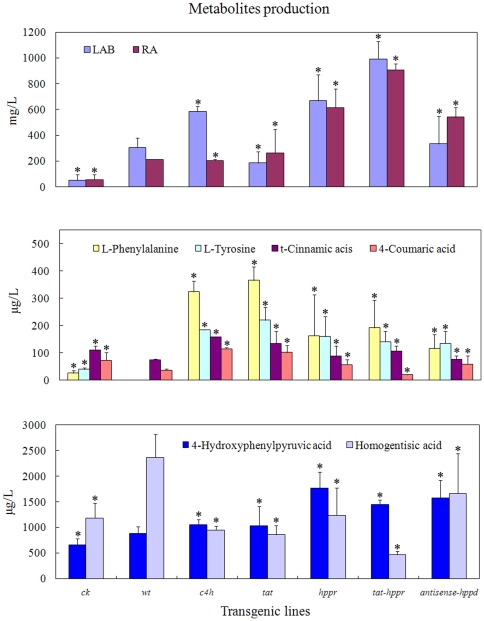
Figure 5. Metabolites production involved in phenolic acids biosynthetic pathway in transgenic hairy root lines.
Each set of bars corresponds to one transgenic line, and within each set the replicates of independent transgenic line are as depicted by Table 1. Error bars show the standard deviations of independent lines. Asterisk indicates that difference is significant at p<0.05 compared with vector control and untransformed control. ck; empty vector transformed lines (vector control), wt; the untransformed hairy root lines (wild-type control).

