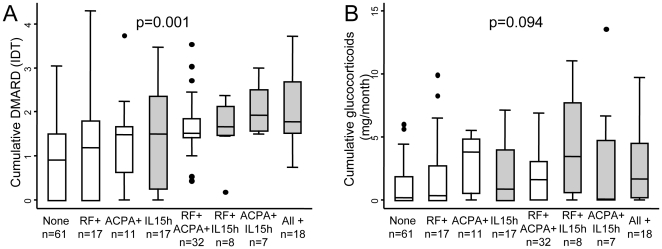
Figure 3. Intensity of treatment in a population of early arthritis patients.
A) Cumulative DMARD treatment during the follow-up period, estimated through the IDT variable (see Methods), in the different subpopulations clustered by the elevated IL-15 serum levels (IL-15 h), the presence of rheumatoid factor (RF+) and/or anti-citrullinated peptides antibodies (ACPA+). B) Distribution of the cumulative glucocorticoid dose adjusted to the number of days of follow-up in the different subpopulations clustered by the elevated sIL-15, RF and/or ACPA. Grey boxes represent those patients with high IL-15 alone or in combination with other biomarkers. In all panels the data are presented as the interquartile range (p75 upper edge of the box, p25 lower edge, p50 midline in the box), as well as the p95 (upper line from the box) and p5. Dots represent the outliers. Statistical significance was established through Kruskal-Wallis test.

