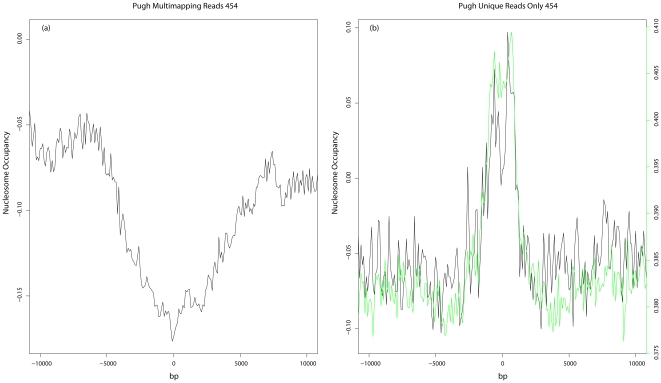
Figure 6. Effect of including multimapping reads.
(a) Plot of nucleosome occupancy at hot spots using data produced by the Mavrich et al. mapping approach. (b) Plot of nucleosome occupancy of the same dataset at hot spots using uniquely aligned reads only. Green line represents GC content as calculated in Fig. 4.

