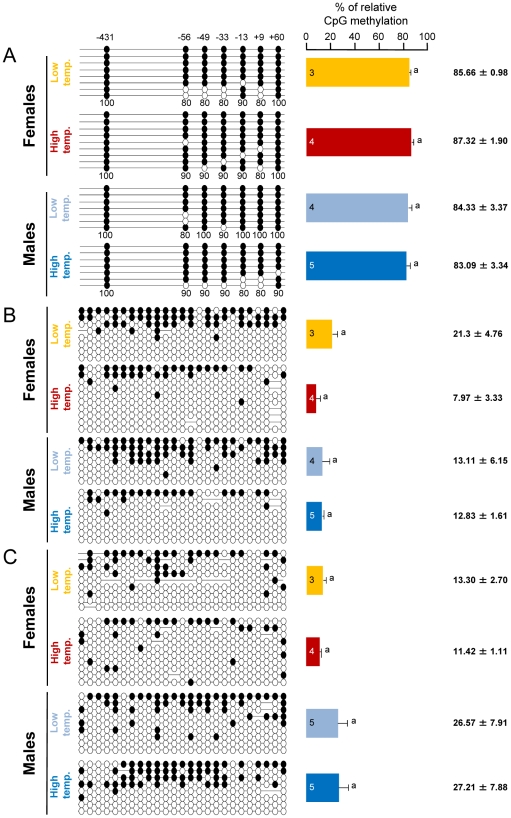
Figure 4. Tissue and gene specificity of the effects of temperature on DNA methylation in one-year-old sea bass.
A, Resulting differences in sb cyp19a promoter DNA methylation in the brain according to sex and temperature treatment. B, Resulting differences in sb ß-actin promoter DNA methylation in the gonads according to sex and temperature treatment. C, Resulting differences in sb ß-actin promoter DNA methylation in the brain according to sex and temperature treatment. On the left, one fish representative of the level of methylation is shown per each sex and temperature combination. Open and filled circles denote unmethylated and methylated positions, respectively, while no circles denote unknown methylation status due to sequencing problems. Numbers with a plus or minus sign indicate CpG positions with respect to the transcription starting site. Average methylation was calculated for each position in each gene promoter (7 and 25 CpGs in the sb cyp19a and ß-actin gene promoters, respectively) but due to space limitations is shown only for the sb cyp19a promoter as numbers below each column (A). For each sex and temperature combination, 3–5 fish sampled at 330 dpf were used, and for each fish typically 8 clones (range 7–10) were used to determine DNA methylation levels. The number inside the bar indicates sample size. Results as mean ± SEM. Groups with the same letters are not significantly different (P>0.05).

