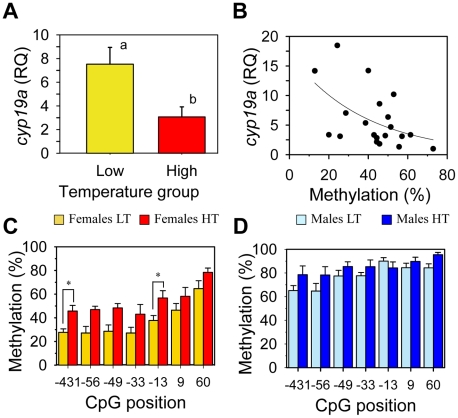
Figure 5. Effects of temperature on sb cyp19a promoter methylation levels and correlation with gonadal cyp19a gene expression.
A, Female sb cyp19a expression assessed by Q-PCR; data as mean ± S.E.M (see main text for details). Groups with different letters are significantly different (P<0.01). B, Correlation between sb cyp19a methylation level and gene expression in females (male expression levels were too low to be considered). RQ, relative quantity. C and D, Differential methylation levels for each CpG position in females (C) and males (D) reared at low (LT) and high (HT) temperature; data as mean ± S.E.M. Individual CpG analysis was carried out by using Analysis of Molecular Variance (AMOVA), in which Cs were considered methylated positions and Ts unmethylated ones. Results of this analysis are summarized in Table 1.

