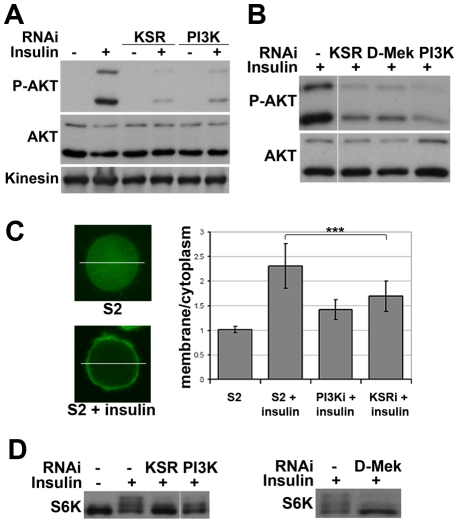
Figure 2. Impaired insulin signaling activation upon MAPK/ERK inhibition.
(A) Immunoblots to detect AKT phosphorylation. Cells were treated with dsRNA to deplete KSR or PI3K and stimulated with insulin (10 µg/ml, 30 min; “+”) or left untreated (“−”). AKT phosphorylation was detected by an antibody specific for the phosphorylated form of the AKT ‘hydrophobic motif’ site S505. Antibody to total AKT protein and Kinesin were used as loading controls. (B) Immunoblots to visualize the level of AKT S505 phosphorylation and total AKT in cells treated with dsRNA to deplete KSR, D-MEK or PI3K. Cells were stimulated with insulin (30 min). Samples were run on the same gel, but intervening lanes have been removed as indicated. (C) Visualization of the level of PIP3 in the cell membrane by localization of a GFP-GRP1 PH domain fusion protein. Left panel: photomicrographs showing translocation of GFP-GRP1 PH to the membrane upon insulin stimulation. The ratio of membrane to cytoplasmic GFP levels was measured as pixel intensity along the white line. Right panel: histogram showing the ratio of membrane to cytoplasmic GFP levels. PI3K and KSR depleted cells showed less PH domain membrane localization upon insulin stimulation. Student's t-test: (***) p<0.001. (D) Immunoblots to visualize the level of S6K phosphorylation in cells treated with dsRNA to deplete KSR, PI3K or D-MEK. Cells were stimulated with insulin (10 µg/ml, 30 min). The slower migrating forms correspond to phosphorylated S6K. Left panel: samples were run on the same gel, but intervening lanes have been removed as indicated.

