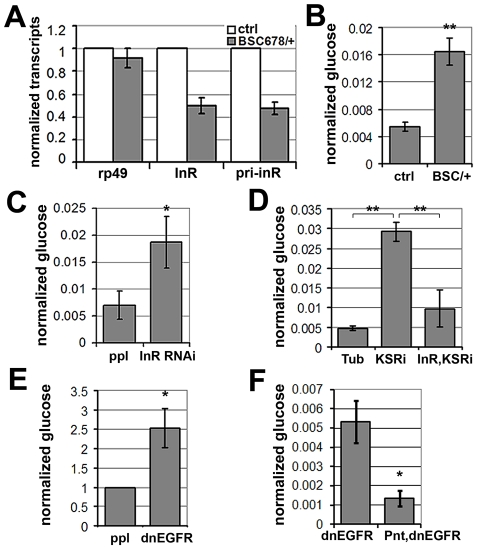
Figure 7. MAPK/ERK regulates inr expression to control circulating glucose levels.
(A) Histogram showing the levels of rp49, inr mRNAs and inr primary transcript (pri-inr) measured by quantitative RT-PCR in control (y−, w−) and Df(3R)BSC678/+ larvae. Error bars represent standard deviation from 3 independent experiments. (B) Histogram showing glucose levels in control (y−, w−) and Df(3R)BSC678/+ larval hemolymph. Error bars represent standard deviation from 3 independent experiments. Student's t-test: (**) p<0.01. (C) Histogram showing glucose levels in hemolymph from larvae expressing UAS-InRRNAi under pumpless-Gal4 control. Error bars represent standard deviation from 3 independent experiments. Student's t-test: (*) p<0.05. (D) Histogram showing the levels of circulating glucose in hemolymph. Wandering 3rd instar larvae expressed UAS-KSRRNAi under Tubulin-Gal4 with or without co-expressed UAS-inr. Controls expressed Gal4 without the RNAi transgenes. Student's t-test: (**) p<0.01. (E) Histogram showing glucose levels in hemolymph from larvae expressing UAS-dnEGFR under pumpless-Gal4 control. Error bars represent standard deviation from 3 independent experiments. Student's t-test: (*) p<0.05. (F) Histogram showing the levels of circulating glucose from larvae expressing UAS-dnEGFR without or with overexpression of Pointed under pumpless-Gal4 control. Error bars represent standard deviation from 3 independent experiments. Student's t-test: (*) p<0.05.

