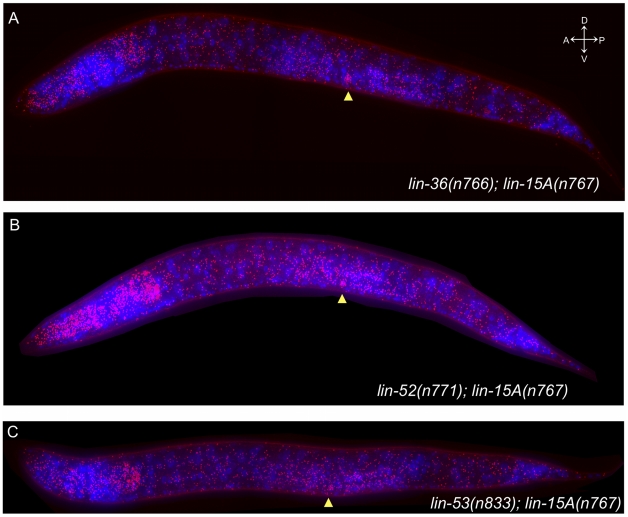
Figure 4. Multiple class B synMuv mutations have similar effects on lin-3 mRNA expression.
FISH of lin-3 mRNA in late L2 to early L3 animals. Each dot represents a single mRNA molecule [42]. lin-3 mRNAs are shown in red, and 4′,6-diamidino-2-phenylindole (DAPI) staining of nuclei is shown in blue. The images shown are maximum intensity projections of a z-stack of images. The anchor cell (AC) is indicated by an arrowhead in each panel. Each mutant displayed ectopic lin-3 mRNA expression throughout the animal in most if not all tissues. (A) lin-36(n766); lin-15A(n767). (B) lin-52(n771); lin-15A(n767). (C) lin-53(n833); lin-15A(n767).

