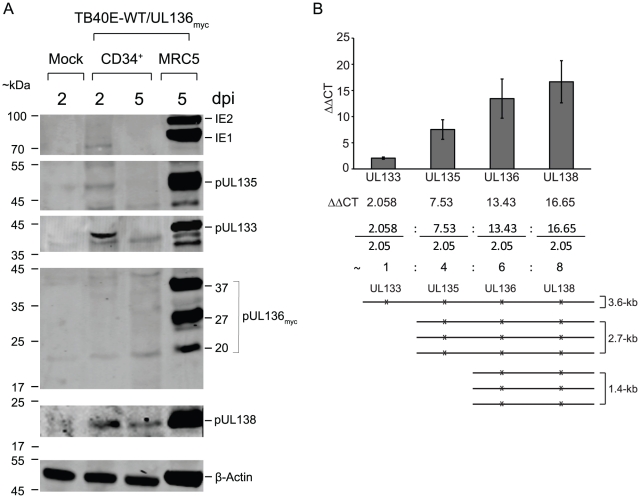
Figure 6. UL133-UL138 locus expression in CD34+ HPCs.
CD34+ HPCs infected with TB40E-WT or TB40E-UL136myc at MOI 2.0. Pure populations of infected CD34+ cells were maintained in LTBMC. (A) Lysates prepared from equal cell numbers at 2 and 5 days post infection (dpi) were analyzed by immunoblotting using either mouse anti-myc antibody to detect pUL136 or rabbit polyclonal antibodies directed against pUL133, pUL135, or pUL138. β-actin was used as a loading control. (B) RNA isolated from infected CD34+ HPCs was analyzed at 2 dpi by qRT-PCR. The relative target levels for UL133, UL135, UL136, and UL138 transcripts were determined using the ΔΔCT equation and are expressed here as a fold over β-actin that was used as an internal reference. The ratio of 3.6-, 2.7-, and 1.4-kb transcripts is indicated. A schematic representative of the relative abundance of each transcript is shown. The bars represent an average of three replicates where the standard deviation is shown.

