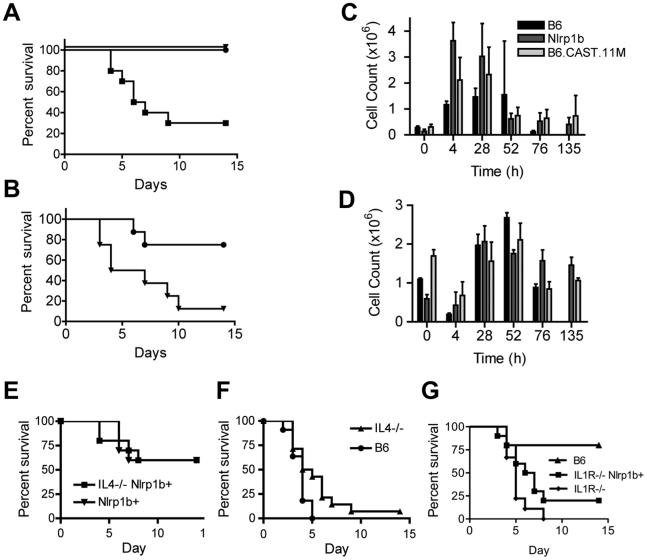
Figure 4. B6.CAST.11M mice display increased resistance to infection by B. anthracis Sterne.
A, Kaplan-Meier analysis of B6.CAST.11M (n = 8)(circles), B6Nrlp1b (129S1) (n = 8)(triangles), or nontransgenic littermate control mice (n = 8)(squares) challenged i.p. with 3×10⁷ spores of B. anthracis Sterne strain 7702. Survival curve p<0.0001 for both experimental groups compared to B6 control. B, Kaplan-Meier analysis of B6.CAST.11M (n = 8)(circles) or B6Nrlp1b (129S1) (n = 8)(triangles) challenged i.p. with 4×10⁸ spores of B. anthracis Sterne strain 7702. Survival curve p = 0.0126. C & D, For cellular analyses at infection site following spore challenge, animals were euthanized at the indicated time points and the number of PMNs (C) and monocytes (D) in the peritoneal cavity were determined as described in the Materials and Methods section. Data represent mean values (n = 3 except, n = 2 for B6.CAST.11M at 72 h and B6Nrlp1b (129S1) at 135 h, and n = 0 for B6 at 135 h) ± SD. Differences in PMN counts were significant as indicated: [t = 4 h, p = 0.025 B6.CAST.11M vs B6; p = 0.003 B6Nrlp1b (129S1) vs B6; p = 0.04 B6.CAST.11M vs B6Nrlp1b (129S1)] [t = 28, p = 0.016 B6Nrlp1b (129S1) vs B6; p = 0.038 B6.CAST.11M vs B6]. Data for B6 animals at 135 h is absent as no B6 mice survived until this time point. E, Kaplan-Meier analysis of B6Nlrp1b (129S1)/IL4 −/− (n = 10) and B6Nlrp1b (129S1) (n = 10) mice challenged i.p. with 1.14×10⁸ spores of B. anthracis Sterne strain 7702. F, Kaplan-Meier analysis of IL4 −/− (n = 14) and B6 animals (n = 11) challenged i.p. with 2.42×10⁷ spores of B. anthracis Sterne strain 7702 (right panel). Survival curve, p = 0.033 G, Kaplan-Meier analysis of IL1R −/− mice with (n = 10) and without (n = 9) LT-sensitive 129S1 allele Nlrp1b challenged with 1.8×10⁶ spores of B. anthracis Sterne strain 7702. Animals were monitored for 14 days for survival.

