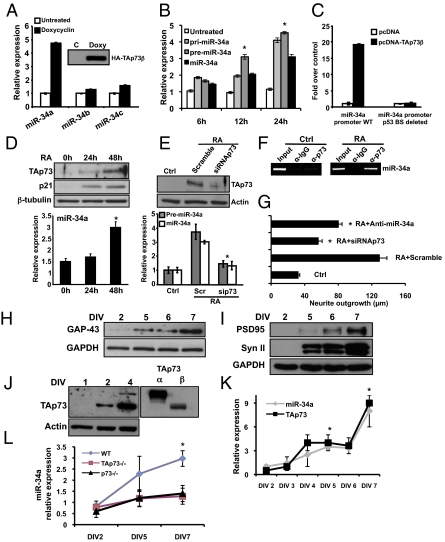
Fig. 1.
TAp73 drives the expression of miR-34a and in vitro terminal differentiation of cortical neurons. (A) SAOS-2-TAp73β inducible cell lines were treated with Doxycyclin for 24 h to overexpress the human TAp73β protein (Inset, Western blot). Endogenous levels of miRs-34a, -34b, and -34c were assessed by real-time PCR. (B) SAOS-2-TAp73β inducible cell lines were treated with Doxycyclin for the indicate times and endogenous levels of pri-miR-34a, pre-miR-34a, and miR-34 were evaluated by real-time PCR. *P < 0.05. (C) The miR-34a promoter region between −1,472 and +551 bp, which contains a p53 consensus site was analyzed for TAp73β responsiveness. Insertion of this miR-34a promoter region in a luciferase reporter gene leads to increased luciferase activity in the presence of TAp73β in SAOS-2 cells. (D) TAp73 regulates miR-34 in RA-induced terminal differentiation of a neuroblastoma cell line. SHSY-5Y cells were treated with 10 μM RA and expression of TAp73, p21, and β-tubulin was assessed by Western blot. Expression of miR-34a was evaluated by real-time PCR (Lower, histogram). (E) p73siRNA prevents the up-regulation of precursor-miR-34a and miR-34a after RA treatment. *P < 0.05. (F) ChIP assay on SHSY-5Y cells untreated (ctrl) or treated with RA. Protein-chromatin complexes were immunoprecipitated with anti-TAp73 or IgG as control antibody. RT-PCR was performed with primers designed against the hsa-miR-34a promoter region containing the predicted and validated p53 binding site. (G) Neurite outgrowth in SHSY-5Y untransfected (ctrl), or transfected with scrambled, siRNAp73, or anti-miR-34a and then treated with RA for 48 h. *P < 0.05. (H and I) Western blot analysis of three different neuronal markers and GAPDH in cultured cortical neurons at DIV2, -5, -6, and -7. Syn II (Synapsin II). (J and K) Cortical neurons were collected at the indicated time points and expression of miR-34a and TAp73 was evaluated by Western blot and real-time PCR respectively. Data represent mean ± SD of three different experiments. *P = 0.016. (L) Relative expression of miR-34a compared between WT, TAp73−/−, and p73−/− mice during terminal neuronal differentiation. Data are normalized to the housekeeping gene Sno202 relative to DIV2. Data represent mean ± SD of three different experiments. *P = 0.045.

