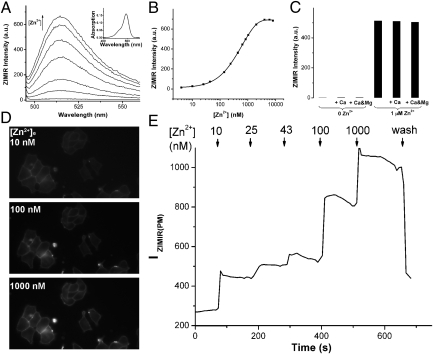
Fig. 2.
Characterization of ZIMIR in vitro and in cells. (A) Zn2+-dependent fluorescence enhancement of ZIMIR-C2. Zn2+ concentrations were 0 nM, 43 nM, 140 nM, 440 nM, 840 nM, 1,640 nM, and 6,440 nM (from bottom to top). (Inset) Absorption spectrum of ZIMIR-C2 changed little with respect to [Zn2+]. (B) Zn2+ titration of ZIMIR-C2 as measured from its emission at 515 nm. The solid line represents the exponential fit. (C) ZIMIR-C2 binds Zn2+ selectively against Ca2+ (1 mM) and Mg2+ (1 mM). All measurements were performed in buffers containing 100 mM Hepes, pH 7.5, with 0.4 μM ZIMIR-C2. Membrane-anchored ZIMIR reports changes of [Zn2+]e. Example ZIMIR fluorescence images of labeled INS-1 cells (D) at different [Zn2+]es and quantification of the average ZIMIR fluorescence intensity along the plasma membrane [IZIMIR(PM)] (E).

