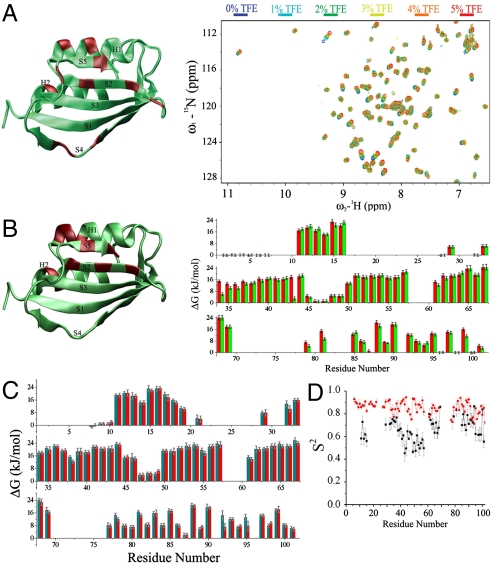
Fig. 1.
NMR measurements of AcPDro2 under conditions where it is highly stable in the monomeric state (A, condition A) or readily self-assembles into amyloid fibrils (B, condition B) or bound to phosphate ions (C, conditions C and D). (A) Spectral changes upon addition of TFE (0% to 5%, condition A to B, respectively). The X-ray structure of AcPDro2 is shown on the left of the panel. Regions shown in red on the structure indicate residues with the largest (at least 1 ppm) changes in the 1H-15N-HSQC spectra. (B) Backbone amide protection factors reported as ΔG values. Red and green bars refer to 0% (condition A) and 5% (condition B) TFE, respectively. The structure of AcPDro2 is drawn on the left of the panel. Regions in red indicate residues showing the largest reductions of the protection factors (Fig. S2). (C) Phosphate-bound AcPDro2 solution states (condition C and D). Backbone amide protection factors are reported as ΔG values. Red and green bars refer to 0% (condition C) and 5% (condition D) TFE, respectively. (D) S2 order parameters measured for the ligand-free (black) and phosphate-bound states (red).

