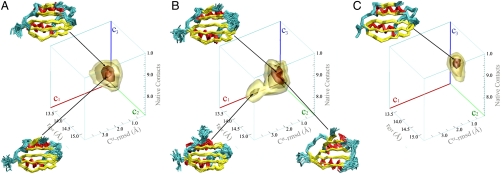
Fig. 2.
AcPDro2 solution state ensembles under conditions where it is highly stable in the monomeric state (A, condition A) or readily self-assembles into amyloid fibrils (B, condition B) or bound to phosphate ions (C, conditions C and D). The solution ensembles were generated by means of restrained molecular dynamics simulations employing the amide exchange NMR protection factors as restraints. The conformations are projected on to three reaction coordinates to define a three-dimensional free energy landscape. The coordinates employed are as follows: Cα rmsd from the crystal structure (c1), radius of gyration (c2), and the fraction of native contacts (c3). The free energy surfaces are drawn by means of contour levels embedding isosurfaces of free energy at levels −7.5, −10, −18, and -24 kJ/mol. The statistical errors for these isosurfaces are 2.17, 1.1, 0.21, and 0.06 kJ/mol, respectively. Representative ensembles in the minima of conformational wells are drawn by Cα traces. Color codes are yellow for β-strands, cyan for loops, red for α-helices.

