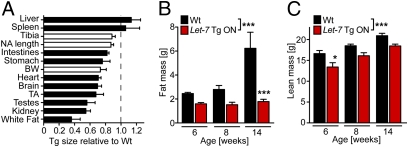
Fig. 2.
Reduced fat mass in Let-7 transgenic mice. (A) Relative organ weight or length [for tibia, nose-to-anus (NA) length, and intestine] of globally Let-7–expressing Tg mice vs. WT mice; n = 3. BW, body weight; TA, tibialis anterior; white fat, epididymal fat. (B and C) Body composition was measured in WT mice and Let-7 -Tg ON littermates at age 6, 8, and 14 wk by EchoMRI; n = 3 or 4 for each time point. *P < 0.05; ***P < 0.001 for WT vs. Let-7 Tg ON by ANOVA with Bonferroni posttest.

