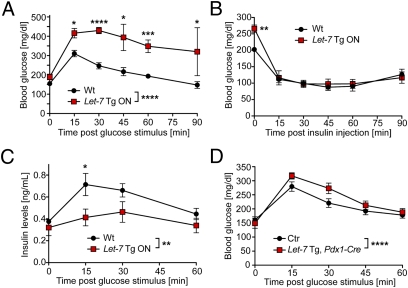
Fig. 3.
Impaired glucose tolerance in Let-7 transgenic mice. (A) A GTT was performed in 7-wk-old WT mice and Let-7 Tg ON littermates after a 7-h fast. Glucose levels were determined at baseline and at the indicated times after an i.p. glucose stimulus (1.5 mg/g body weight); n = 7 (3 for 45 min and 90 min). *P < 0.05; ***P < 0.001; ****P < 0.0001 for WT vs. Let-7 Tg ON by ANOVA with Bonferroni posttest. (B) An ITT was performed in 8-wk-old fed Let-7 Tg ON mice and WT littermates. Blood glucose levels were measured at baseline and 15, 30, 45, 60, and 90 min after i.p. injections of insulin (1.0 U/kg body weight); n = 7. **P < 0.01 for WT vs. Let-7 Tg at baseline by ANOVA with Bonferroni posttest. (C) 7-wk-old Let-7 Tg ON mice and WT littermates were fasted for 7 h and then received a glucose stimulus (1.5 mg/g body weight i.p.). Blood was collected at baseline and after glucose stimulation and used for determination of insulin levels by ELISA; n = 4. *P < 0.05; **P < 0.01 by ANOVA with Bonferroni posttest. (D) Let-7 Tg OFF mice were crossed to Pdx1-Cre mice to induce pancreas-restricted Let-7 overexpression. A GTT was performed in 6-wk-old offspring after a 7 h fast to determine blood glucose levels after i.p. glucose stimulation (1.5 mg/g body weight). n = 5; ****P < 0.0001 for control (WT, Pdx1-Cre Tg, or Let-7 Tg OFF) vs. Let-7 Tg, Pdx1-Cre by ANOVA with Bonferroni posttest.

