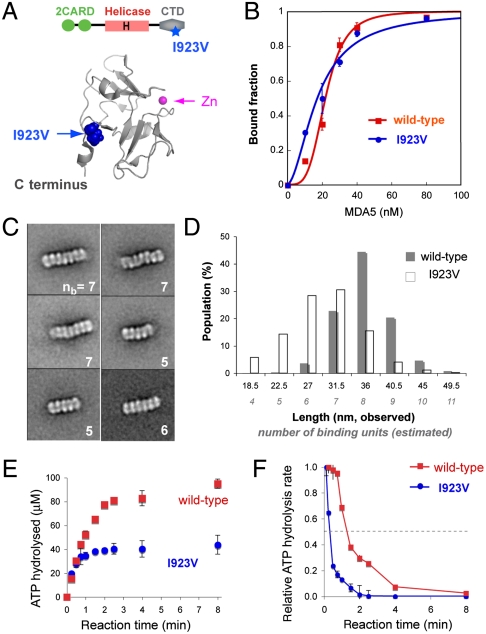
Fig. 5.
SNP I923V forms shorter filaments and exhibits decreased kinetic stability. (A) Cartoon representation of MDA5 CTD [Protein Data Bank (PDB) ID code 2RQB]. Residue I923, distal to the Zn coordination site but proximal to the C terminus, is partially solvent-exposed. (B) EMSA binding curves (mean ± SD, n = 2) of WT and I923V MDA5 with 112 bp dsRNA. (C) Representative class averages of I923V in complex with 112 bp dsRNA. The number of binding units (nb) present for each complex is displayed at the bottom right. See also Fig. S6D. (D) Histogram of the length distribution of complexes formed by WT and I923V with 112 bp dsRNA. Each length represents the median value of each interval. The number of binding units per complex was estimated from the complex length. (E) Single-round ATP hydrolysis kinetics (mean ± SD, n = 3) of WT and I923V (0.2 μM) bound to 2,012 bp dsRNAs (1.2 μg/mL) in the presence of heparin (200 μg/mL). (F) Time evolution of the ATP hydrolysis rate derived from E using the finite difference method. Rates were normalized against the initial rate during the first 15 s.

