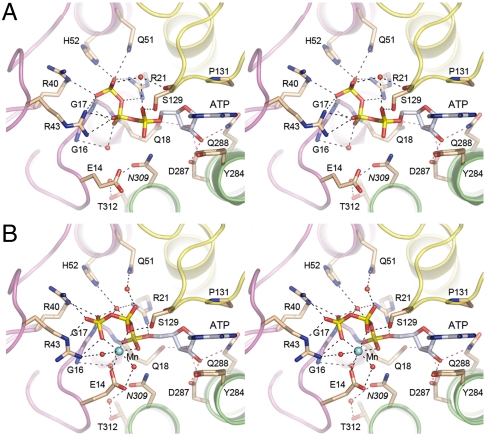
Fig. 2.
Atomic contacts to ATP and divalent cation in the RtcA active site. Stereo views of the active site of the RtcA•ATP complex (A) and the RtcA•ATP•Mn2+ complex (B). The main-chain cartoon traces are colored by domain as in Fig. 1 B. Amino acids and ATP are shown as stick models with beige and gray carbons, respectively. Waters are depicted as red spheres and Mn2+ as a cyan sphere. Atomic contacts are indicated by dashed lines.

